< Back to titles
> Cover Page, Authors, Institutions
> Purpose/Objective
> Materials/Methods
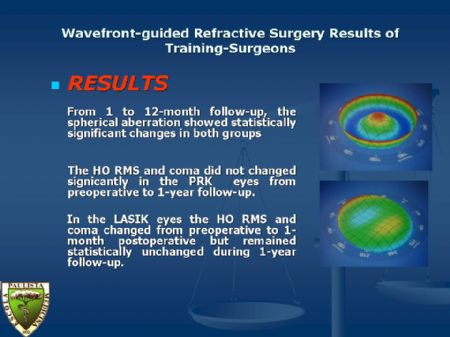
> Results
> Conclusions
> View additional images/videos
|
|
Click on images to enlarge (a new pop-up window will open)
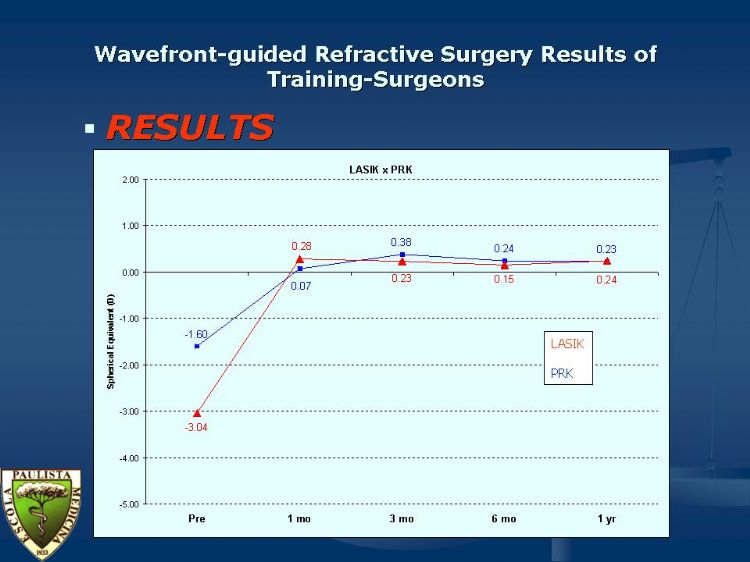
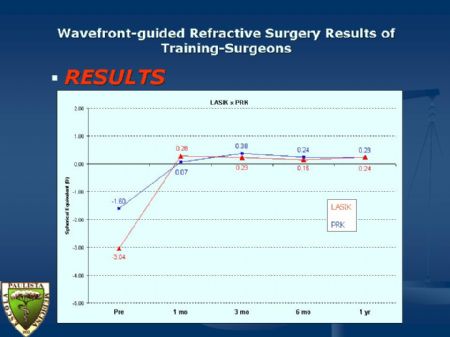
Mean Refractive Error Lines Over Time:
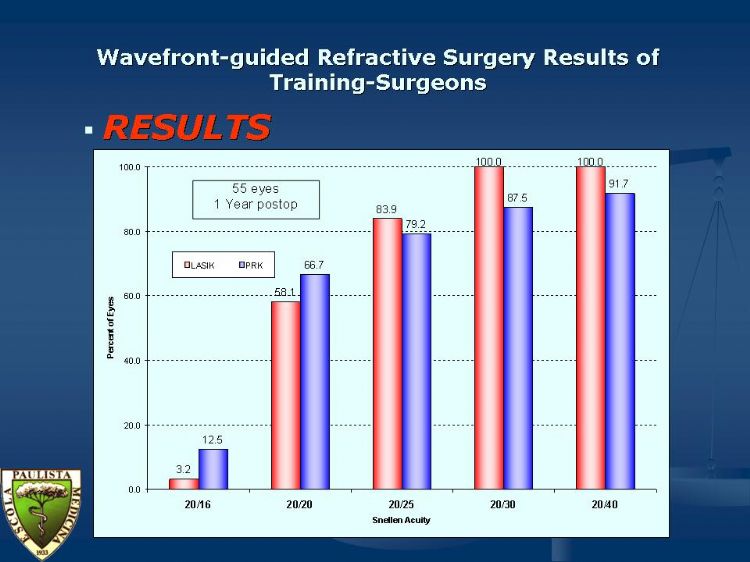
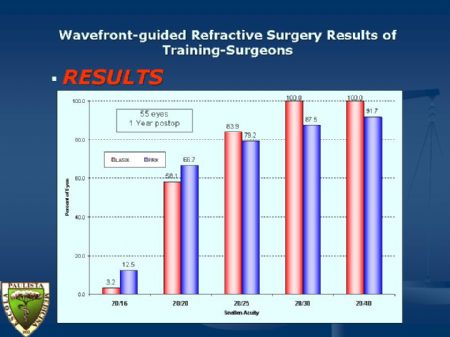
Snellen Visual Acuity Bars Graph:
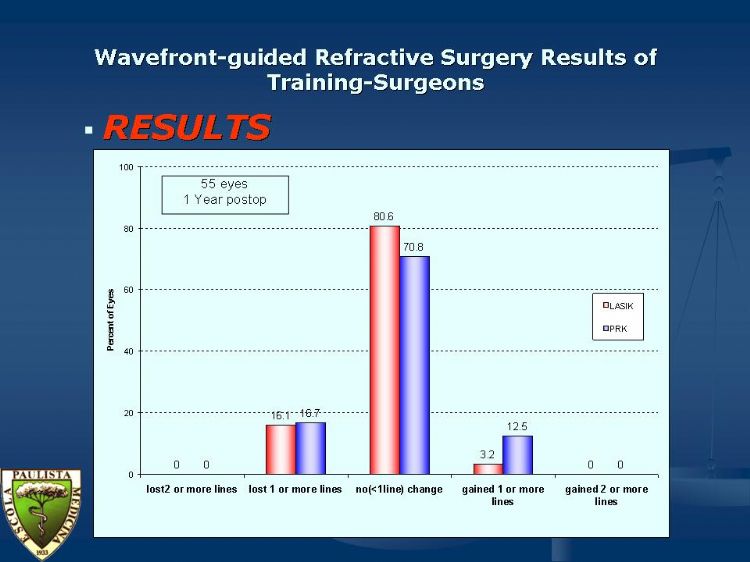
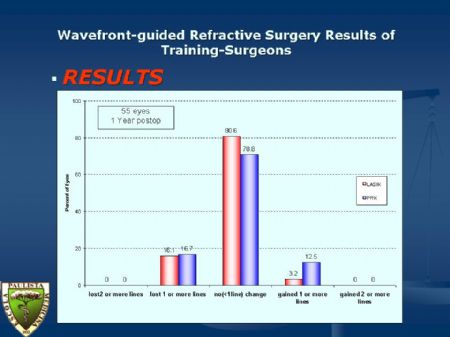
Changes in Snellen Lines of Visual Acuity:
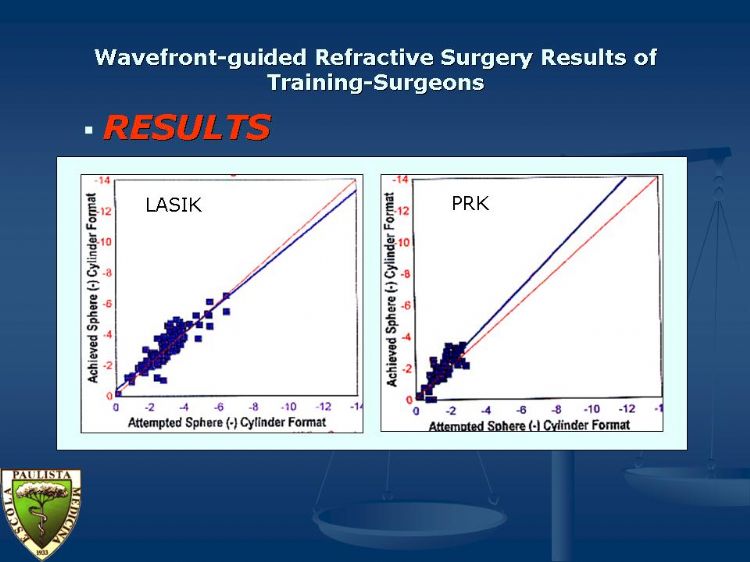
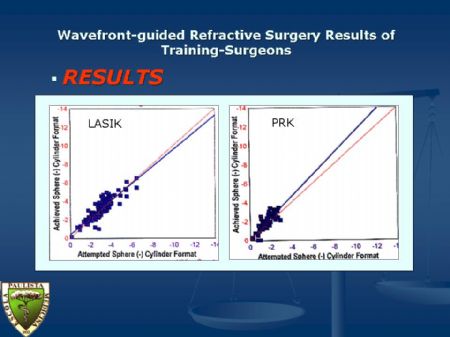
Scattergram of Attempted vs. Achieved Refraction:
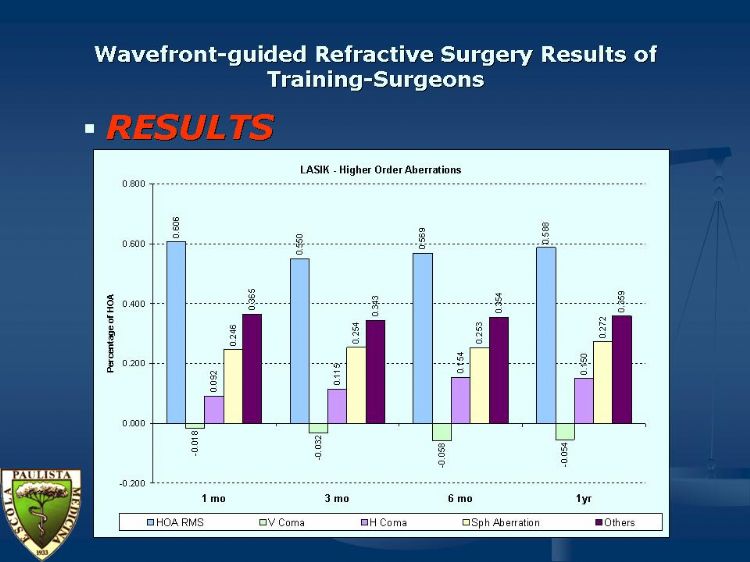
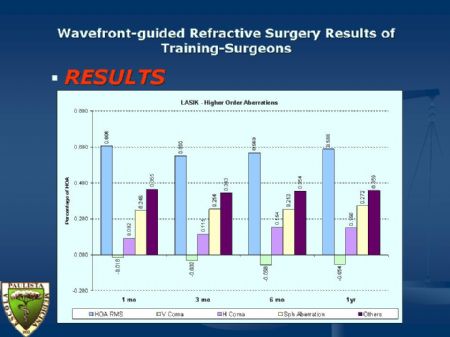
Stability Plot: Higher-order Aberrations Post-Custom LASIK:
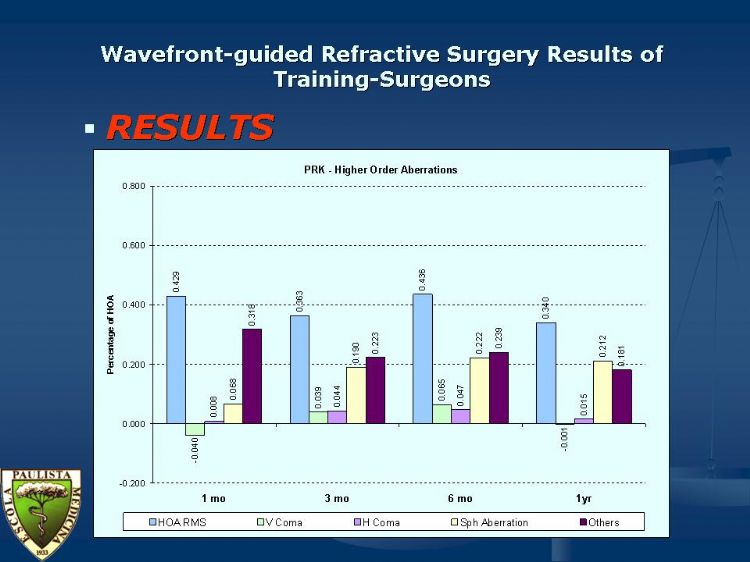
Stability Plot: Higher-order Aberrations Post-Custom PRK:
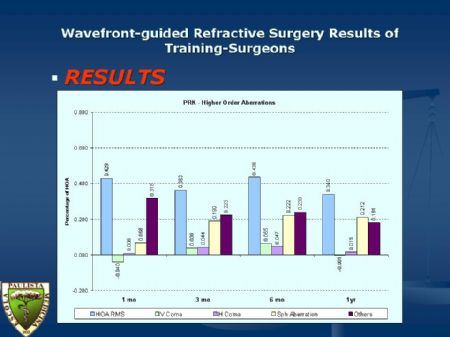
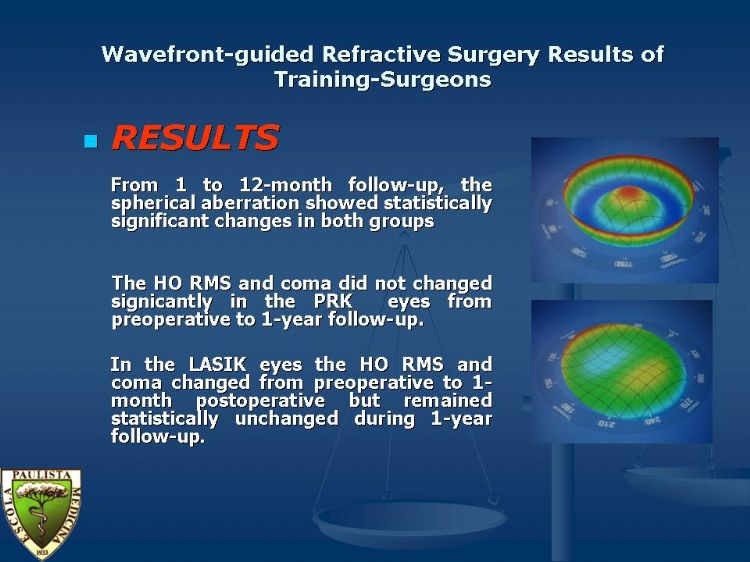
Results:
|