< Back to titles
> Cover Page, Authors, Institutions
> Purpose/Objective
> Materials/Methods
> Results
> Conclusions
> View additional images/videos
|
|
Click on images to enlarge (a new pop-up window will open)
Results 1:
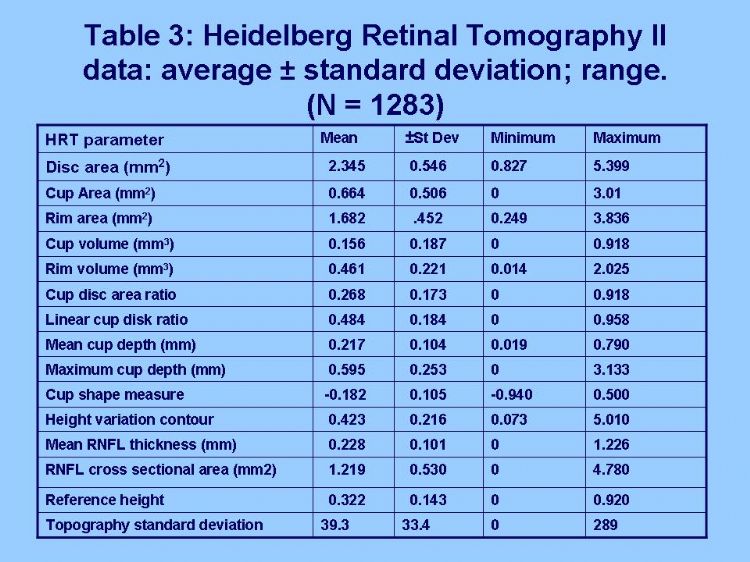
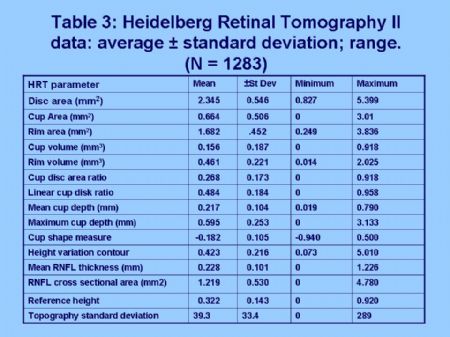
Heidelberg Retinal Tomography II data: average +/- standard deviation; range:
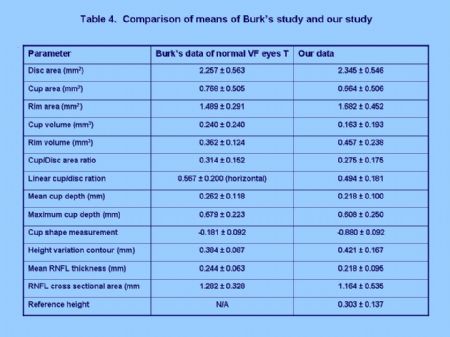
Results 2:
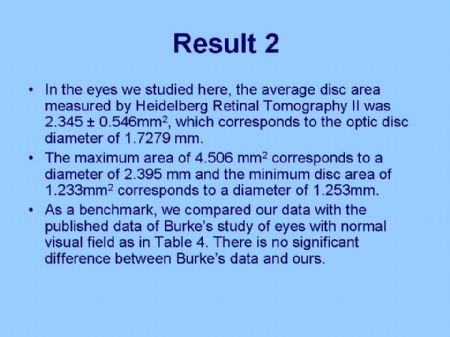
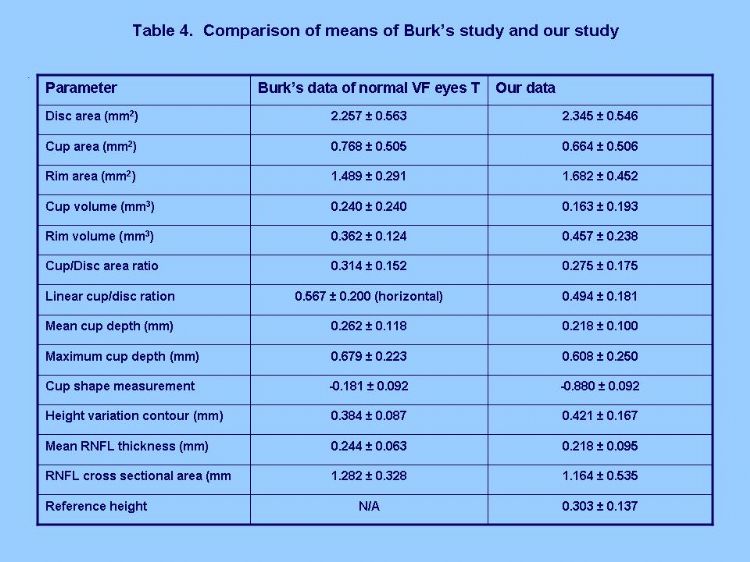
Table 4. Comparison od mean of Burk's study and our data:
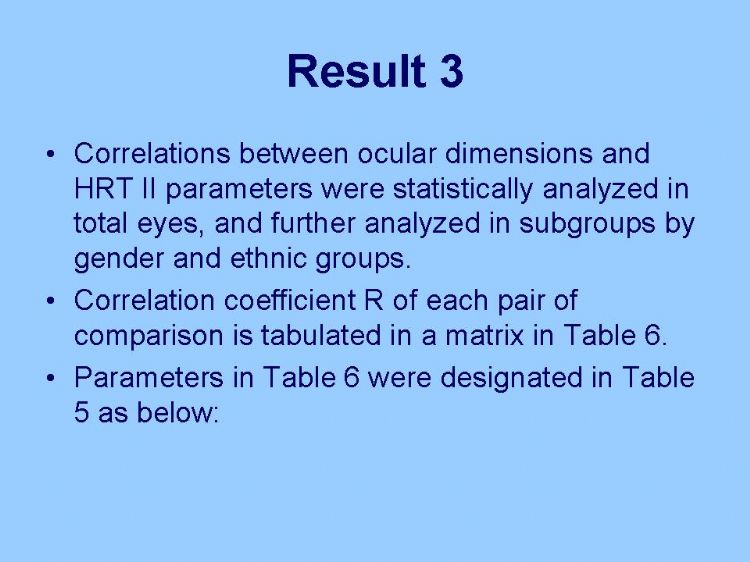
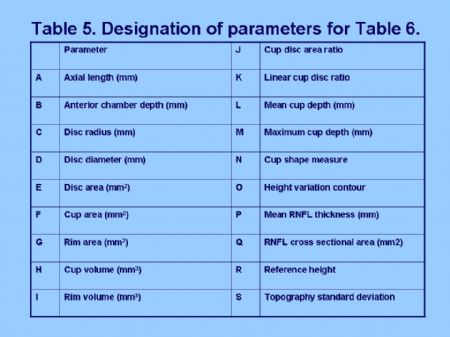
Results 3:
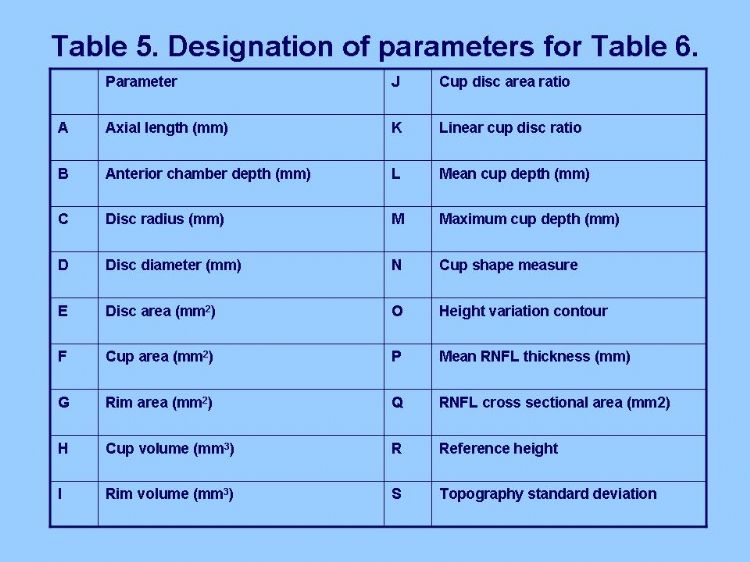
Table 5, Designation of parameters for Table 6.:
Discussion 1:
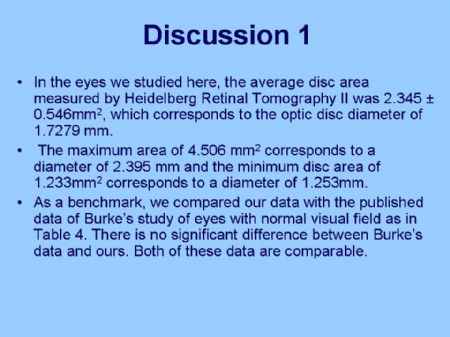
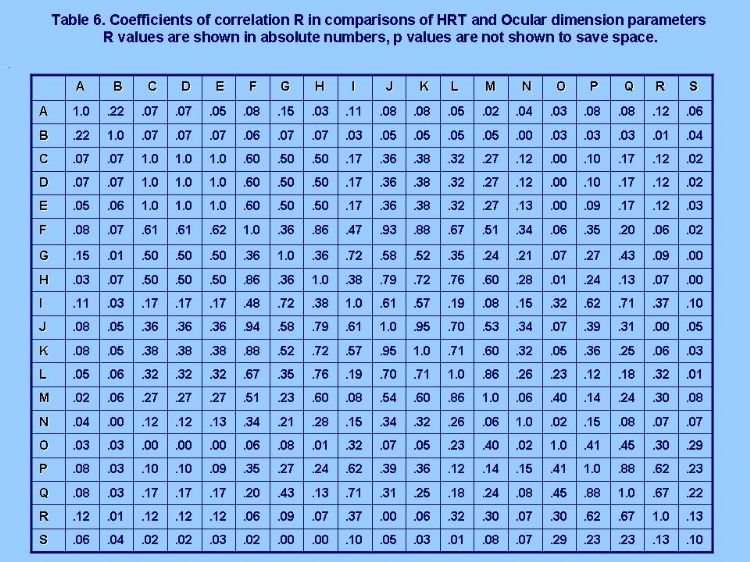
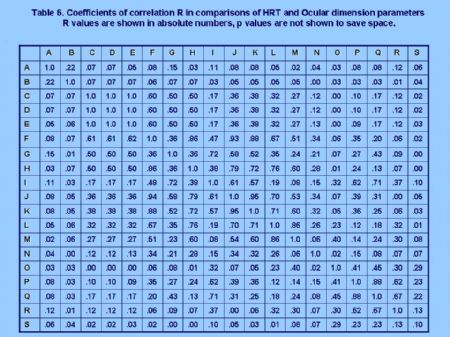
Table 6. Coefficients of correlation R in comparisons of HRT and Ocular dimension parameters:
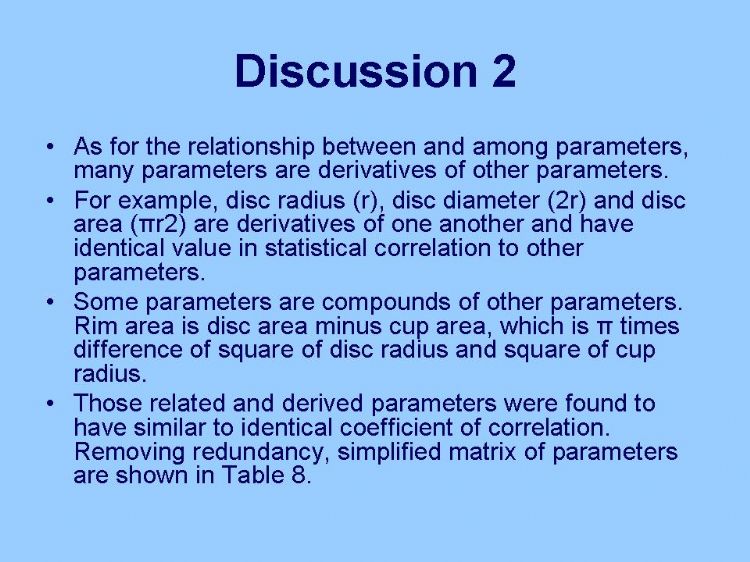
Discussion 2:
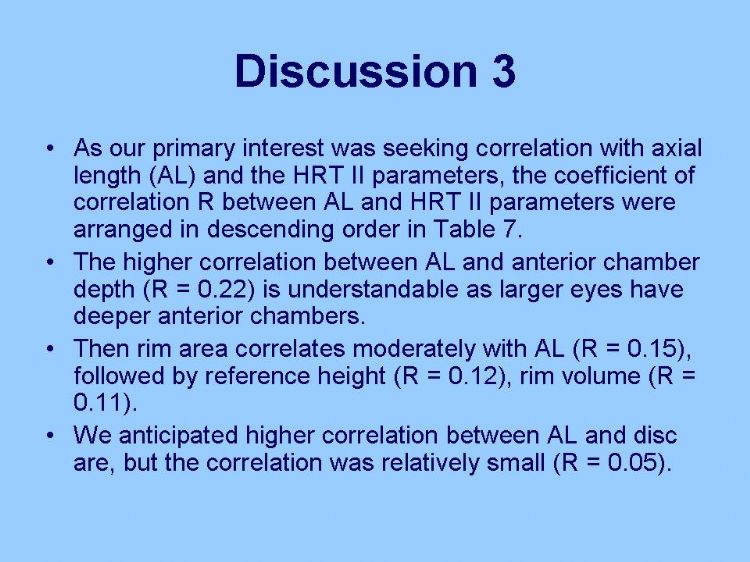
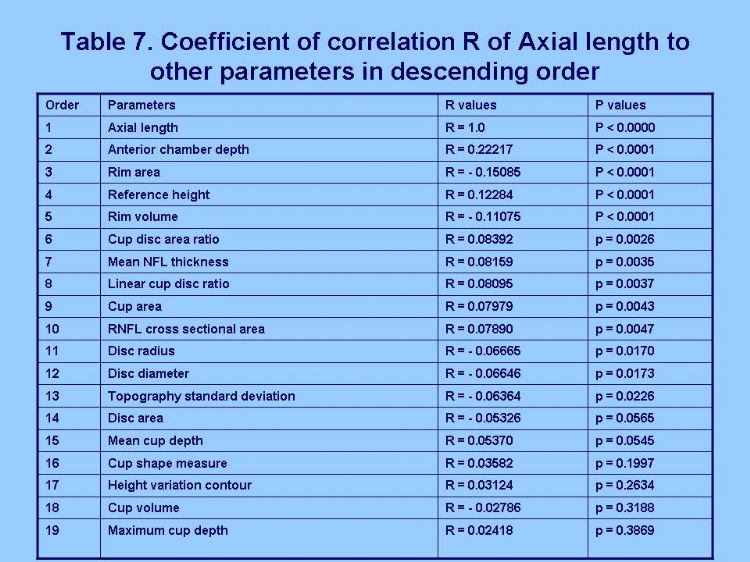
Discussion 3:
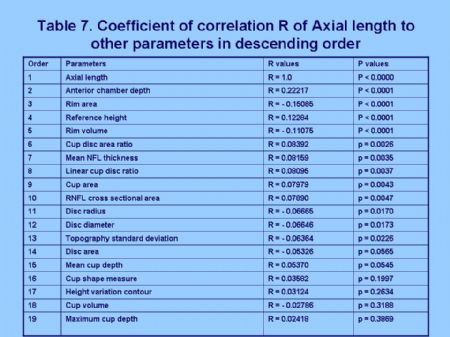
Table 7. Coefficient of correlation R of Axial length to other parameters in descending order:
Discussion 4:
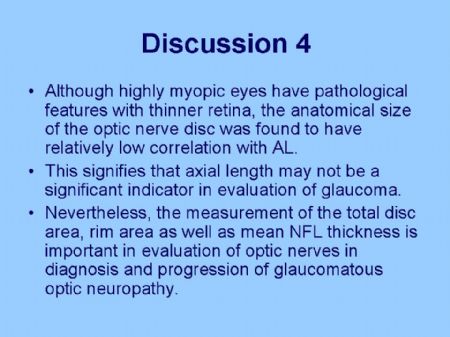
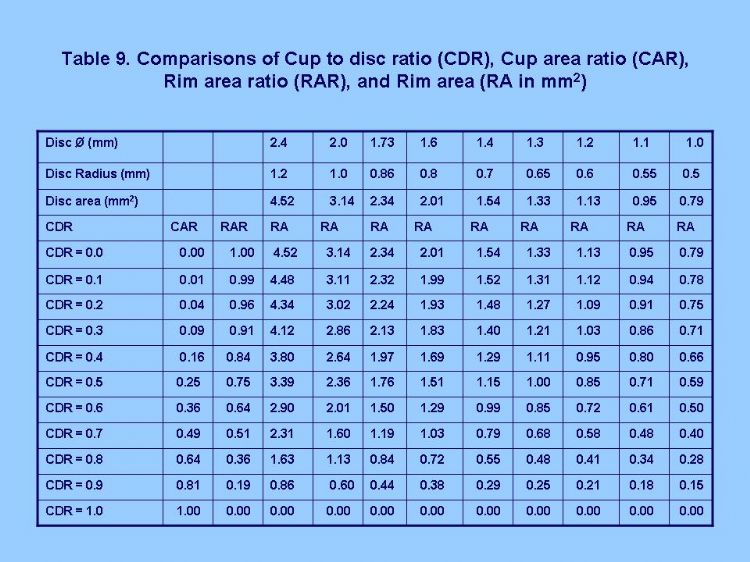
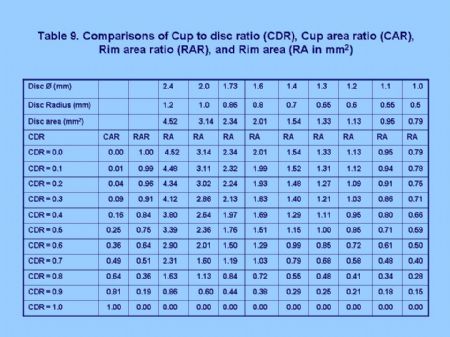
Table 9 Comparisons of Cup to disc ratio(CDR), Cup area ratio (CAR), Rim area ratio (RAR), and RA:
|